
Michael Lascarides(@mlascarides) is a maker of web sites and can usually be found in a library. He was born in New Jersey to a family of die-hard Philadelphia Phillies fans who have greeted his recent conversion to cricket with a mixture of confusion and sympathy. He lives in Kapiti.
I'm an American baseball fan who moved to New Zealand a couple of years ago, and I got my introduction to cricket when some co-workers took me along to a Black Caps Twenty20 match. Instantly captivated, I set about studying all that I could about the game, but found myself quickly struggling to get a foothold of understanding among the endless rows of numbers that comprise the game's statistics. As a visually-oriented (and perhaps slightly obsessive) person who designs and builds web sites as a day job, I began exploring cricket's intricacies by creating my own graphic visualisations of the results of matches, with the goal of getting as much information as possible about each match into a single view.[1]
I started playing with these charts a bit over a year ago during the summer holidays (Corey Anderson's record-breaking century in Queenstown on New Year's Day 2014 was my first attempt), and have been working quietly on them on and off since then. When the ICC Cricket World Cup rolled around this year, I started charting the pool matches and showing the results to my co-workers, who encouraged me to share them more widely. I've since posted visualisations of every match of the World Cup so far on my site.
These tools came in handy on Saturday night, after I raced back home from Westpac Stadium in Wellington with my throat sore from yelling my head off, because there was no performance I more wanted to see rendered than Martin Guptill's astonishing 237 not out against the West Indies.
The main chart I've been working on is a modified "Manhattan" graph, in that it's essentially a series of bars whose heights show the number of runs in each over. However, I've broken down each bar to show a distinct mark for each ball bowled. Cricket is all about the steady accumulation of runs, and I've tried to stay true to that central fact by showing an individual mark for every ball in play, while still letting the overall shape of the match be read at a glance. Here's how it renders Saturday's Black Caps vs. West Indies match.
Click on the photograph to see the full version
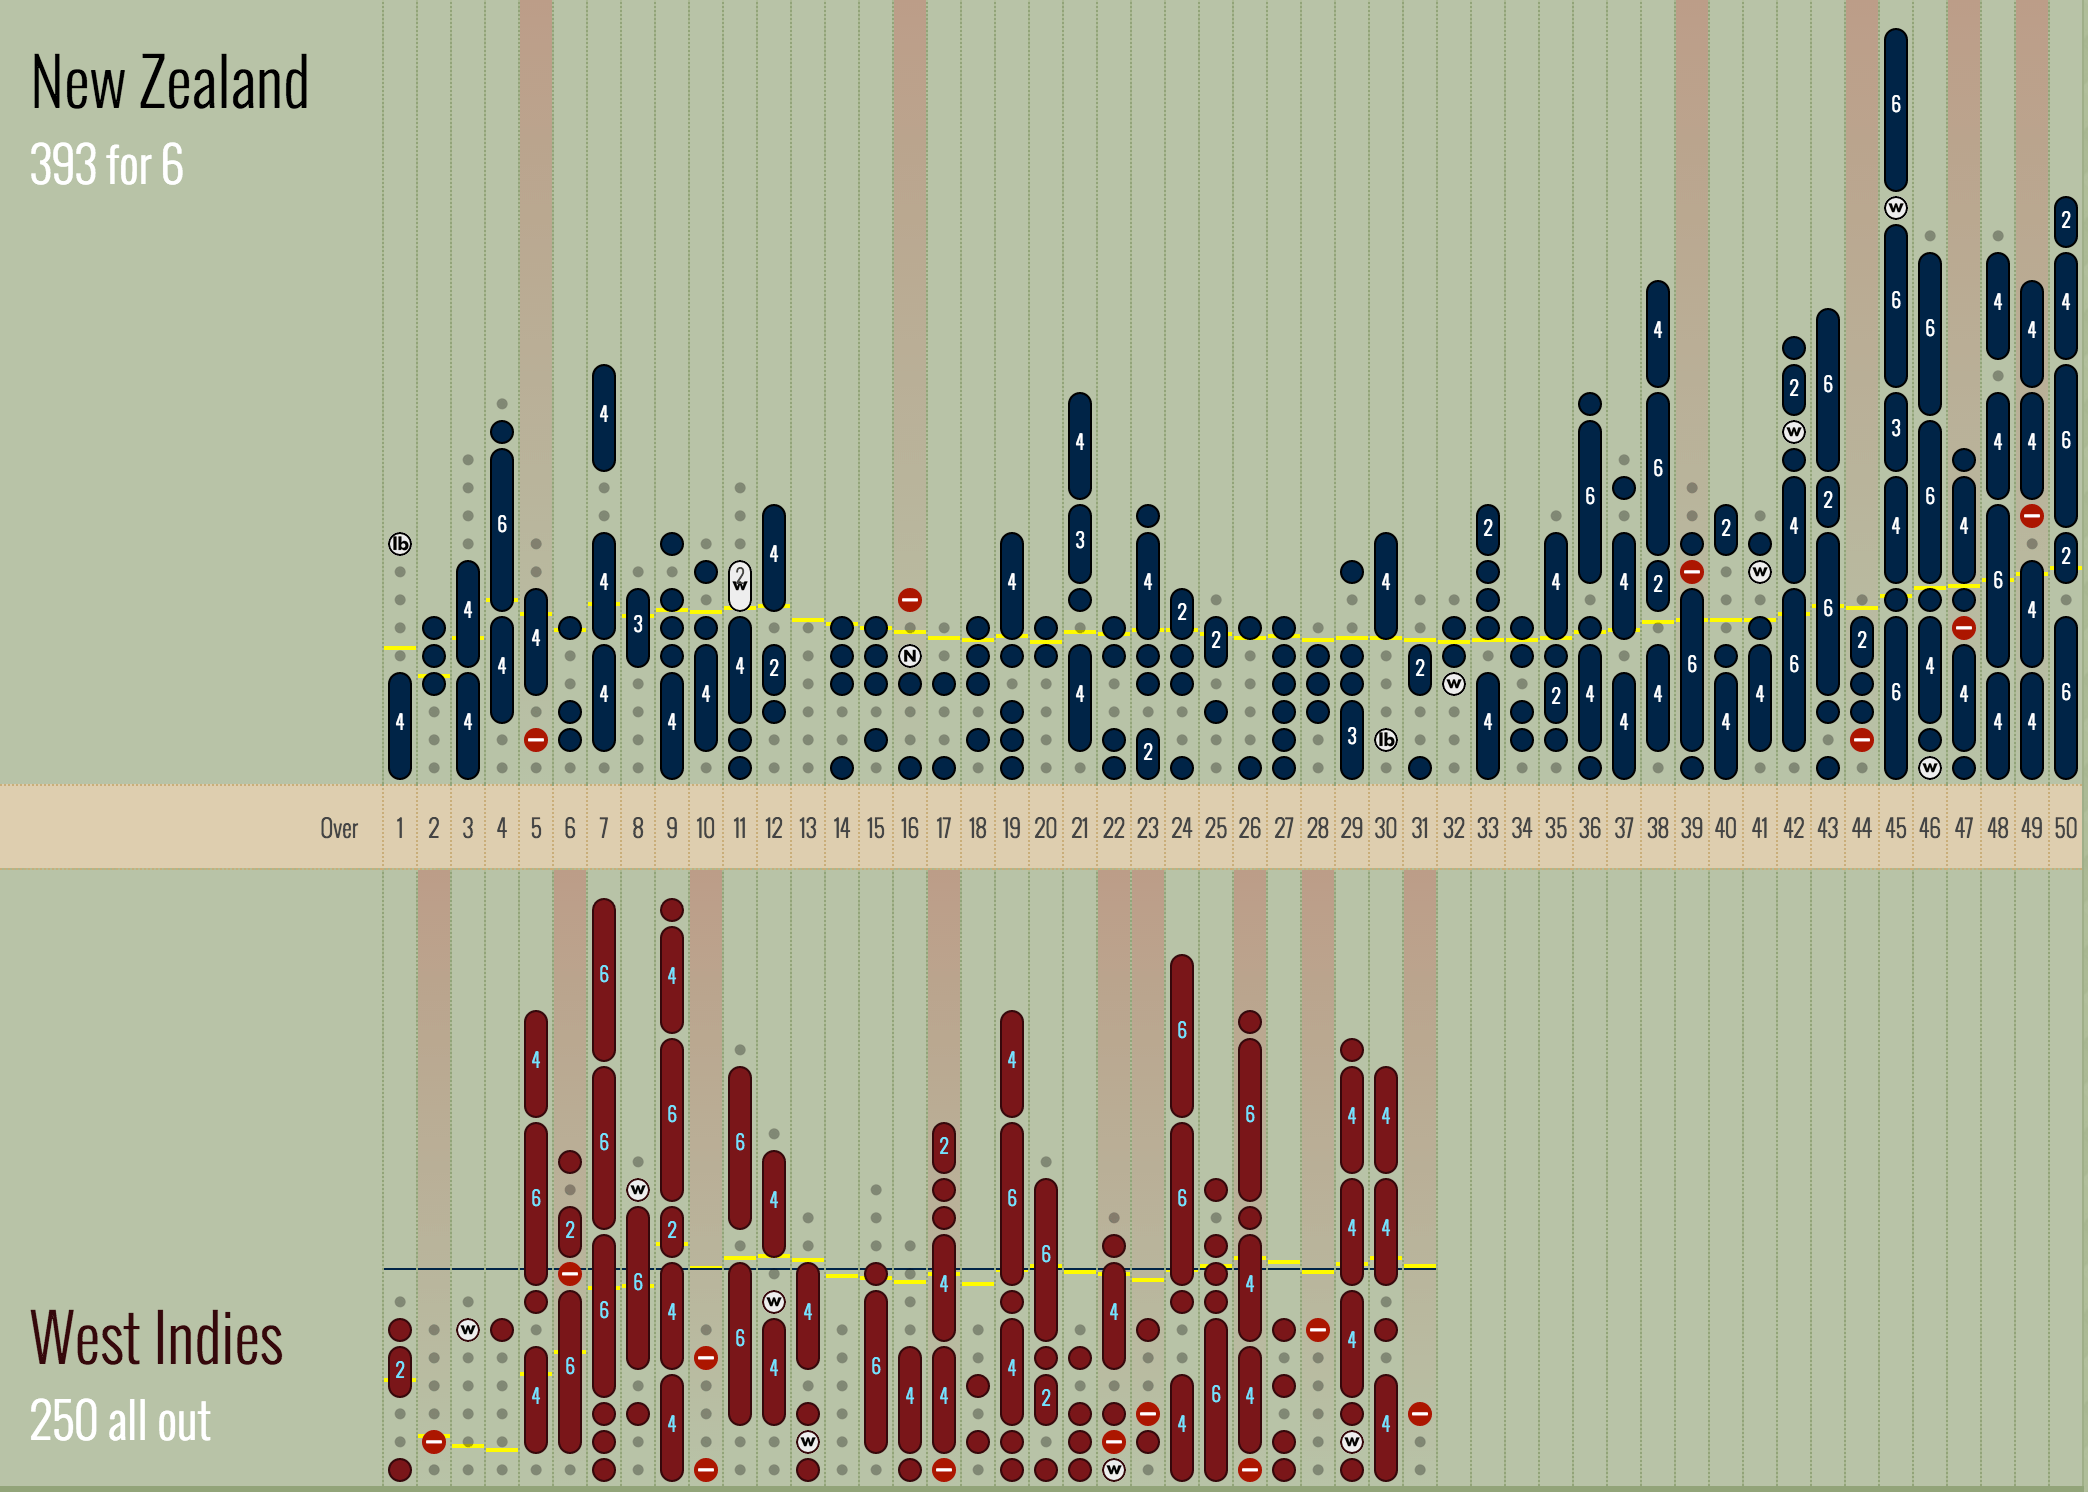
In this view, dot balls (deliveries for no runs) display as, well, a dot. A single run is a filled-in circle, and balls for more than one run display as an oblong shape proportionally as high as the number of runs (3 runs are the height of 3 balls, 4 run 4 balls high, etc), accounting for a small amount of padding between each mark. That tiny padding makes a huge visual difference, allowing each mark to read as distinct, even at the end of a long match.
I've used the colours of each team to display batted runs. Extras that occur due to bowling faults (leg balls, wides, no balls, etc) are displayed in white, making them stand out at a different visual value and making matches with wild bowling performances immediately obvious. Wickets are in stop-sign red, and overs containing wickets have a reddish-shaded background.
Since dots are the same size as 1 run balls, the height of the bars are not, strictly speaking, proportional to amount runs in an over-for example, six single runs are the same height as a maiden-but overall, I think the visual impact is pretty successful at getting the point across, especially when the sixes start flying into the stands.
Behind the bars, I'm showing the current run rate as a yellow line, using the height of the balls as a scale (that is, a 6.0 run rate is marked at exactly the height of six balls). In the second innings, the first team's run rate shows as a target as well. I've got some ideas about how to show the required run rate, which I hope to apply soon. (Note that in Saturday's match, West Indies actually finished the match outpacing the Black Caps' run rate-fortunately for the home team, they bled wickets to get there).
In the "live" version of these graphics on my site, information about each ball call be viewed by pointing at it, and individual performances can be highlighted (from the Match pages on the site, use the "Batting" and "Bowling" tabs on the right to select a player). Guptill's 237 thus rendered is a thing of beauty, only marred by the red wicket symbol in the 39th over when Ross Taylor was run out while Guptill batted.
Click on the photograph to see the full version

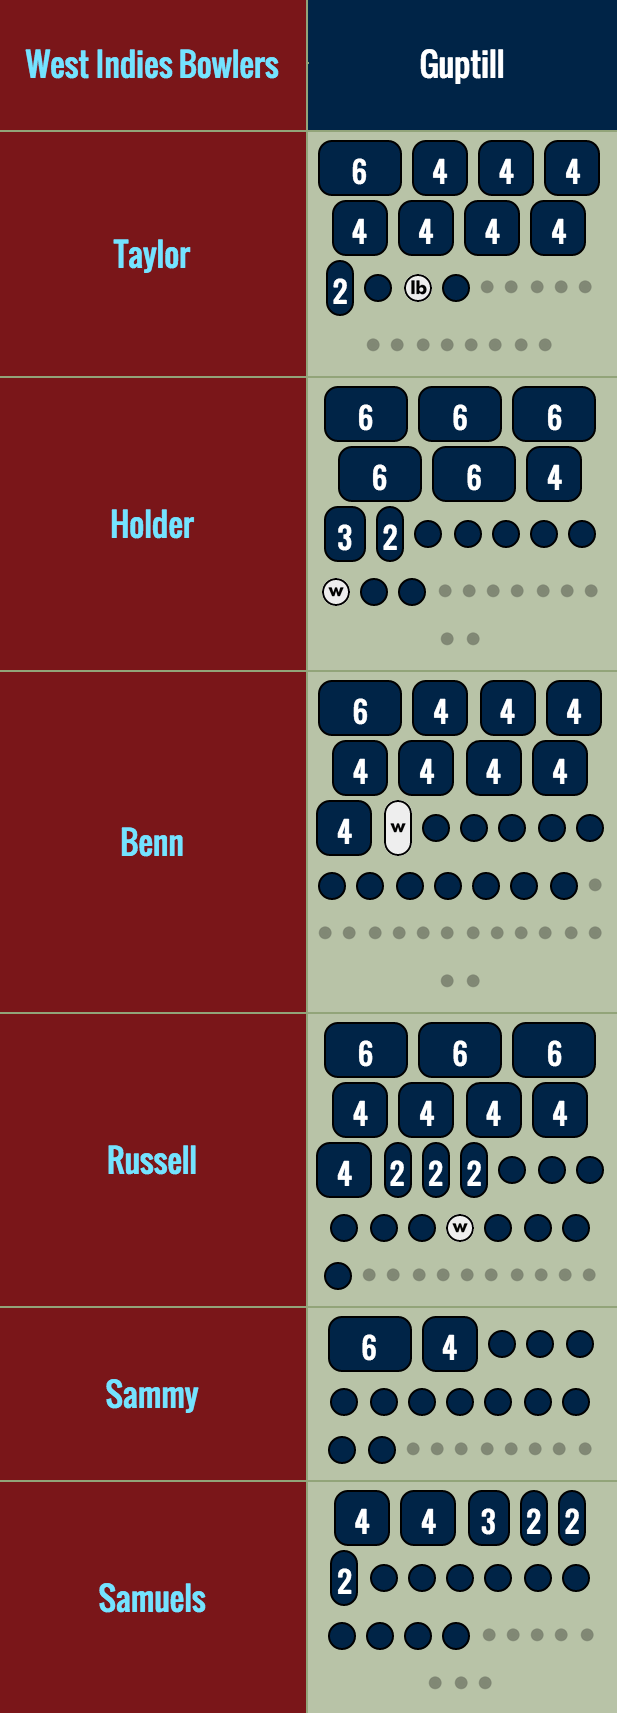
Below the overs chart, I've also included a Head To Head chart, which shows the accumulation of runs between a given bowler and batsman. Bold red frames show wickets. Once again, every ball delivered makes a mark, and the size of the marks is proportional to the number of runs scored. Guptill's haul is no less impressive in this view, and shows what an equal opportunity marauder of West Indies' bowlers he was.
Click on the photograph to see the full version
I will be posting the remaining matches of the World Cup shortly after they complete, and there are still many improvements I plan to make (I've included a tally of shortcomings on the front page of my site). If you have any questions or feedback, I'd be happy to field them on Twitter, where I'm @mlascarides.
----
[Footnote 1]: For those interested in the technical details: I start by gathering ball-by-ball results from a variety of sources (including ESPNCricInfo and BBC Sport for recent matches, and the wonderful cricsheet.org for older ones), and then use a web application written in the Ruby scripting language to create the charts. I'm not using any "fancy" graphics tools such as D3; these graphics are 100% made from good old HTML and CSS3, with a bit of Javascript to manage the interactivity and to properly place the run rate indicators.

